TAM, SAM and SOM split a market into three nested layers: everyone who could theoretically buy your product (Total Addressable Market), the slice you can actually reach and serve (Serviceable Addressable Market), and the share you can realistically win (Serviceable Obtainable Market).
That part is easy. The hard part is where the numbers come from, and this is where almost every guide on the subject quietly gives up.
Here is a worked example that does not. Belgium has 1,187,819 VAT-registered enterprises. If you sell B2B software to companies with at least ten employees, your real addressable market in Belgium is 37,855 companies, or 3.19% of the headline figure. Every Belgian market figure in this article comes from the public register, and you can reproduce all of them yourself.
Published 11 September 2026. Figures reflect Statbel's 31 December 2024 reference date, which is updated annually.
Key takeaways
Belgium has 1,187,819 VAT-registered enterprises, but 997,481 of them have no employees at all (84%). The headline count is a population, not a buyer pool.
Filtering to 10+ employees leaves 37,855 companies. Filtering to 50+ leaves 7,896.
Build TAM bottom-up from a register you can query, not top-down from an analyst report whose method you cannot inspect. The argument for bottom-up is traceability, not accuracy. And we sell bottom-up data, so weigh that.
Stop counting and start assuming only at the SOM step, and label that step as an assumption.
This article sizes a market in accounts, not euros, because account counts are the part you can verify. Converting to revenue is a separate step built on your own pricing.
What is TAM SAM SOM?
TAM SAM SOM is a three-layer market sizing model: TAM is total demand, SAM is the part you can serve, and SOM is the part you can realistically win in a set period.
TAM (Total Addressable Market) is total demand if you had no constraints at all: every company that could use the product, everywhere, regardless of whether you can reach them.
SAM (Serviceable Addressable Market) is the part of TAM you can serve given real constraints: geography, language, company size, regulation, sector, the way you sell.
SOM (Serviceable Obtainable Market) is what you can realistically capture in a defined period, given your competitors, your sales capacity and your win rate.
The three are usually drawn as nested circles, the TAM SAM SOM diagram in every pitch deck. The picture is fine. The problem with the model is that the numbers written inside the circles are almost always invented. Market sizing is the arithmetic underneath B2B prospecting: the same filters that define your SAM define your target list.
The problem with most market sizing guides
We reviewed the pages ranking in Belgium for "tam sam som" on 11 September 2026. Most follow the same shape: define the three terms, draw the circles, explain top-down versus bottom-up, then demonstrate with an example built on round numbers that come from nowhere: a €10 billion market narrowing to €3 billion, with no derivation offered for either figure.
The guidance on sourcing is thinner still. The most common advice is a list of analyst firms and statistics offices, sometimes paired with an admission that those firms' methodology is not published.
That is the whole gap. Nobody shows you where to get a number you can defend. So here is the method, applied to a market you can check.
TAM SAM SOM example: sizing a Belgian B2B market
The source is Statbel, the Belgian statistics office, which publishes counts of active VAT-registered enterprises broken down by NACE-BEL activity code, employee size class and region. Reference date is 31 December 2024, published October 2025. Statbel gives you aggregates; if you need the company-level records behind them, that comes from the Belgian company register.
Step 1: start with the register, and know what it is
At the end of 2024 Belgium had 1,187,819 active VAT-registered enterprises (Statbel). That population turns over faster than a single number suggests, which is why a market size has a shelf life. See how many start and stop each year, and how many survive.
Know what this frame includes before you build on it. "Active" is an administrative status, VAT registration excludes activities and entity types that are VAT-exempt, and the employee size class is a joined administrative field rather than a headcount someone confirmed. It is a very good frame for Belgian B2B and it is not a census of economic activity. An article that tells you to interrogate other people's sources should state the limits of its own.
Step 2: remove the companies that cannot buy
Break the same 1,187,819 down by number of employees and the picture changes completely.
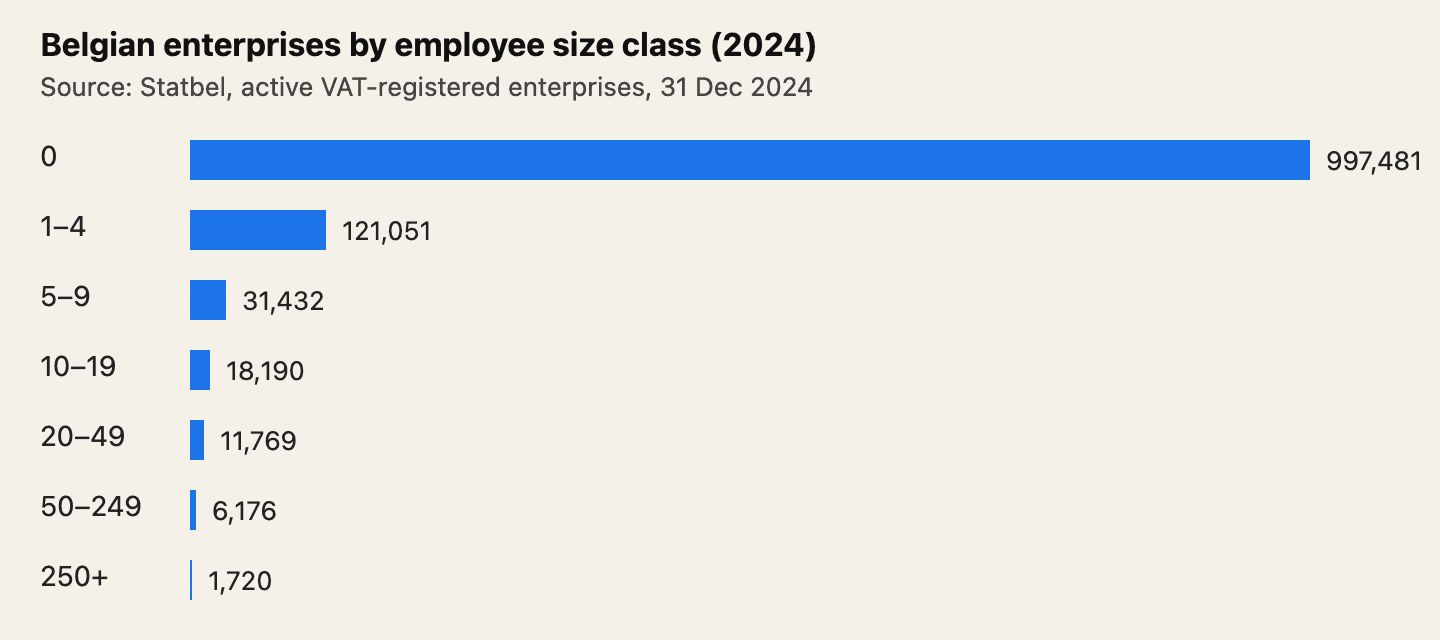
The bars are drawn to a single honest scale, which is why the top two are barely visible. Here are the same per-class figures as text:
Employees | Enterprises |
0 | 997,481 |
1–4 | 121,051 |
5–9 | 31,432 |
10–19 | 18,190 |
20–49 | 11,769 |
50–249 | 6,176 |
250+ | 1,720 |
997,481 of those companies, 84% of them, have no employees at all. Statbel does not break down what sits inside that class, but it is the class that holds sole traders, freelancers, management companies, holding vehicles and dormant entities. If your product needs a team to be worth buying, very few of them are prospects.
Strip them out and the ladder looks like this:
At least | Companies | Share of headline TAM |
1 employee | 190,338 | 16.02% |
5 employees | 69,287 | 5.83% |
10 employees | 37,855 | 3.19% |
20 employees | 19,665 | 1.66% |
50 employees | 7,896 | 0.66% |
250 employees | 1,720 | 0.14% |
This single table is the reason most Belgian market sizing is wrong by an order of magnitude. "There are 1.2 million companies in Belgium" is true and irrelevant. If your product needs twenty seats to make sense, you are selling into a market of 19,665. And if you have been planning against a number thirty times larger, every downstream forecast inherits the error.
Step 3: apply sector and size together to get SAM
Now add the activity filter. Say you sell production planning software to manufacturers and you need at least ten employees for the deal to be viable.
Belgian manufacturing (NACE-BEL section C) holds 56,603 enterprises. Of those, 5,606 have ten or more employees, just under 10% of the sector and 0.47% of the national headline figure.
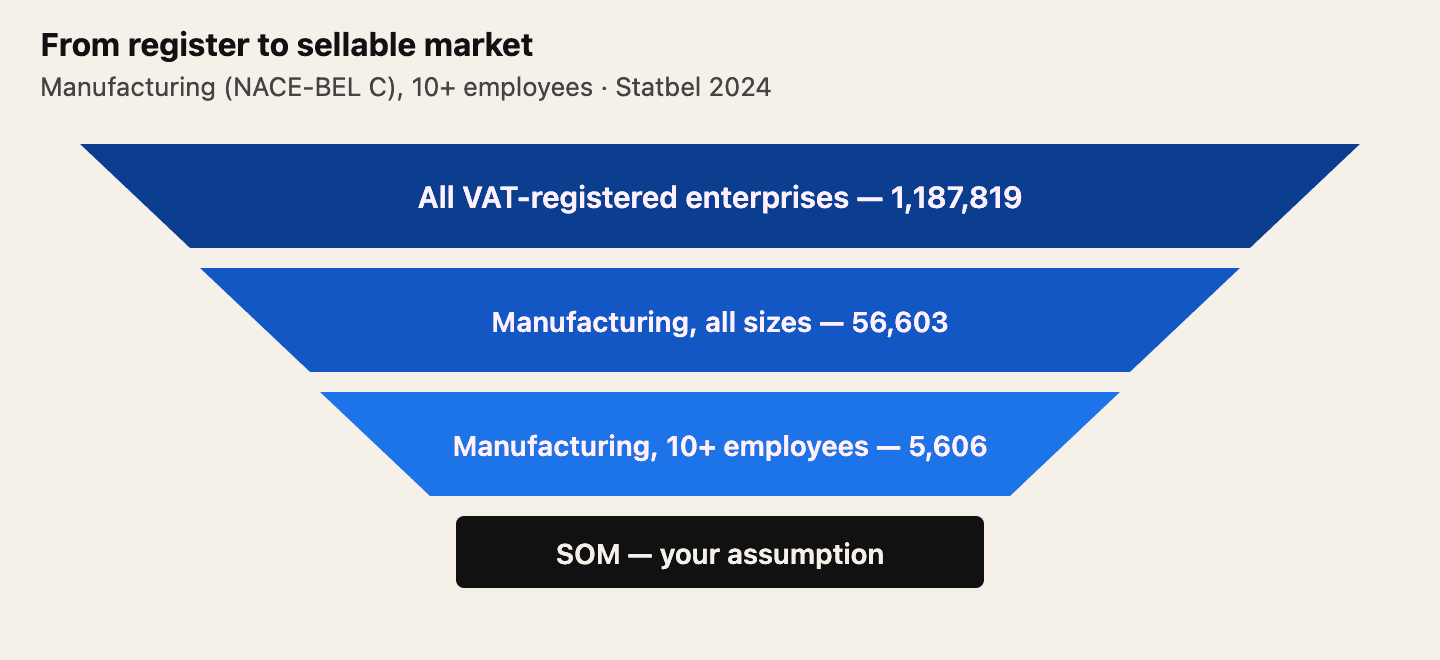
Both of those figures come straight from the same public table. Nothing has been estimated yet. That matters, because it means anyone in the room (a sceptical CFO, a board member, an investor) can open the source and check the arithmetic.
You can narrow further on the same basis. Statbel also counts enterprises by the region of the registered office, and if your team sells only in Dutch that split is a real constraint on your SAM. The full regional breakdown is on our Belgian business landscape reference page; what matters here is that the register can quantify the constraint instead of you estimating it.
One caution, and it is the point of the whole article: do not take the national regional share and apply it to your sector. Manufacturing is not distributed like hairdressing. If you need the regional split within your sector, query that cross-section directly. Multiplying two unrelated percentages together produces a number that looks derived and is actually invented.
Step 4: SOM is where the assumptions start, so label them
There is no public table for "how many of these will buy from you". SOM is where counting stops and judgement begins, and the useful discipline is to make that boundary explicit.
Anchor it on something you have observed rather than a percentage that sounds modest. Your historical win rate against a comparable counted list is evidence, which means you need a consistent definition of what counts as a lead before that rate means anything. "We'll take 1% of the market" is not evidence; as HubSpot's guide puts it, that kind of claim sounds good while proving nothing about whether you can acquire or serve those customers.
A defensible SOM reads like this, with illustrative figures you would replace with your own: of the 5,606 manufacturers with 10+ employees, your team can work 400 accounts a year at current headcount; your win rate on comparable accounts has been 18%; therefore roughly 72 new customers, or €X at your current average contract value. Every input is either counted or measured, and the assumptions are visible enough to argue with.
Capacity is the input teams guess at most often. Our guide to prospecting in Belgium covers how much ground a rep can realistically cover in this market.
Top-down and bottom-up: the honest comparison
Top-down starts from a published category figure, such as "the €X billion European manufacturing software market", and applies a share assumption.
Bottom-up starts from individual companies: count the ones matching your criteria, estimate revenue per customer, add it up.
A disclosure before the argument: we sell register-sourced European company data, which is bottom-up data. Weigh what follows accordingly.
You will read a lot of claims that bottom-up is more accurate. Be careful with that, because almost everyone making the claim sells bottom-up data, us included, and we could not find a published head-to-head comparison of the two methods.
The defensible claim is narrower and stronger: bottom-up is traceable. Every assumption can be inspected, challenged and re-run when the data updates. A category figure from an analyst report cannot, because the methodology usually is not published. HG Insights, another vendor in this space, frames the advantage the same way: bottom-up produces the smaller number, deliberately, and it holds up because the assumptions can be followed.
Use top-down as a sanity check on the order of magnitude. Use bottom-up for anything that a quota, a hiring plan or a board paper depends on.
What forecasting research says about inflated estimates
The most rigorous evidence on inflated demand forecasting does not come from software. It comes from public infrastructure, where the forecasts are published and outcomes can be checked decades later.
Flyvbjerg, Skamris Holm and Buhl studied 210 transport projects across 14 nations worth US$59 billion. For rail, passenger forecasts were overestimated in nine out of ten projects, with average overestimation of 106%. For roads the pattern is different and worth stating plainly, because it cuts against the easy reading: road traffic tended to come in slightly above forecast, but the error was large in both directions: half the projects missed by more than 20%, and a quarter by more than 40%. Most striking of all: forecast accuracy did not improve across the thirty years studied (Journal of the American Planning Association 71(2), 2005; open-access copy).
That is a different industry, and it would be dishonest to present it as a measurement of B2B market sizing. Its relevance is the mechanism rather than the number. Estimates produced to justify a decision already taken go wrong systematically rather than randomly, and better tools have not fixed it. Lovallo and Kahneman described the same pattern in corporate strategy as the planning fallacy: managers overestimate benefits and underestimate costs, partly through optimism and partly through the incentives around getting a plan approved (Harvard Business Review, 2003).
The remedy proposed in that literature is reference-class forecasting: anchor on what actually happened to comparable cases instead of on your own model. For market sizing, that means anchoring SOM on your observed win rate against a counted list, exactly the discipline in step 4.
Eight mistakes that show up again and again
Citing a category TAM as if it were your SAM. A headline market figure includes submarkets, buyer types and geographies you do not serve.
The "we only need 1%" argument. It says nothing about whether you can reach or serve those customers.
Using data older than two years. Company registers move. HubSpot's guide recommends a two-year limit on inputs, which is a reasonable standard to hold yourself to.
Trusting aggregates you cannot inspect. If the methodology is not published, you cannot defend the number when someone pushes back.
Defining SAM on firmographics alone. Sector and headcount are a starting point, not a complete qualification. Two companies with identical NACE codes and employee counts can have entirely different budgets. Filed annual accounts are where that difference becomes visible.
Ignoring uneven competitive density. Your win rate is not uniform across a SAM. Where an incumbent is entrenched in one region or vertical, your obtainable share there is lower.
Producing the estimate to justify a decision already made. This is the failure mode the forecasting research documents most clearly.
Treating TAM as revenue potential. TAM is a ceiling that nobody ever reaches, not a target.
How to calculate TAM, SAM and SOM for your own segment: a six-step template
Find your NACE-BEL code. Identify the activity codes that actually describe your customers, usually two to five rather than one. Start from the codes your best existing customers are registered under rather than from the code you would choose for them.
Pick your size floor. Be honest about the smallest company where the product earns its price. This step removes more of the market than any other.
Pull the count. Query active VAT-registered enterprises by activity and employee size class, and read the figure off directly rather than estimating it. Activity codes are a blunt instrument here, because a company doing something new is often filed under something old, so where a code list fails, semantic search over company websites, headcount growth or hiring activity will define a segment that NACE cannot. Bizzy exposes those alongside the registry filters; we have also compared the Belgian prospecting tools that expose these filters.
Add geography only if it constrains you. Language coverage and field-sales reach are real limits; add them if they apply, and query the cross-section rather than multiplying shares.
Write the SOM assumptions down. Capacity, win rate, average contract value, time period. Name them as assumptions so they can be challenged and revised.
Recalculate annually. Statbel's figures update once a year, published each October, which is a sensible cadence for the count. Revisit the SOM inputs whenever headcount or win rate moves materially.
For a European rollup rather than a single country, cross-check against Eurostat's business demography data, which covers size classes and NACE activities across the EU. If the market you are sizing is one you also intend to sell into, our comparison of B2B prospecting tools for Europe covers the tooling side.
Read next: NACEBEL codes: how to look them up, and why yours may be wrong.
Read next: Generating leads: from a company list to a conversation.
Read next: B2B lead generation: what it is and which strategy fits your market.
Frequently asked questions
What does TAM SAM SOM stand for?
Total Addressable Market, Serviceable Addressable Market and Serviceable Obtainable Market: total demand, the part you can serve, and the part you can realistically win.
How do you calculate TAM SAM SOM?
Count companies matching your ideal customer profile from a register. That gives TAM and SAM in accounts. Convert to euros only if you need a revenue figure, using your own average contract value. For SOM, apply your sales capacity and observed win rate. Counting beats estimating at every step where a count is available.
How many companies are there in Belgium in my sector?
Statbel publishes active VAT-registered enterprises by NACE-BEL activity code, employee size class and region. Belgian manufacturing, for example, holds 56,603 enterprises, of which 5,606 have ten or more employees.
What is a realistic SOM percentage?
There is no standard figure, and any guide offering one is guessing. Derive it from your own capacity and win rate against a counted account list.
Why is top-down market sizing often inaccurate?
Published category figures aggregate submarkets you do not sell into, and their methodology is usually not disclosed, so errors cannot be found or corrected.
What data do I need to calculate SAM accurately?
An activity classification (NACE-BEL in Belgium), an employee size class, and a geography filter, all three available from the national statistics office.
Written by Arthur Cremers at bizzy., which builds European B2B company data from official registers. Figures in this article come from Statbel's public tables and can be reproduced from the sources linked below.
Sources
Statbel: Annual evolution of VAT-registered enterprises (published 16 October 2025, reference date 31 December 2024)
Statbel be.STAT: Active VAT-registered enterprises by economic activity and employee size class (updated 23 October 2025)
Statbel be.STAT: Active VAT-registered enterprises by employee size class (updated 23 October 2025)
Statbel be.STAT: Active VAT-registered enterprises by legal form and location of registered office (updated 16 October 2025)
Flyvbjerg, Skamris Holm & Buhl: How (in)accurate are demand forecasts in public works projects?, Journal of the American Planning Association 71(2), 2005
Lovallo & Kahneman: Delusions of success, Harvard Business Review, July 2003
HG Insights: The complete guide to market sizing
HubSpot: TAM, SAM and SOM