Belgium had 1,187,819 active VAT-registered enterprises at 31 December 2024. This is a reference page of the official figures behind that number: how many appear and disappear each year, how many survive, where they sit and which sectors they are in. If you sell into Belgium, the shape of the market matters as much as its size.
All figures come from Statbel, the Belgian statistics office. The reference date is 31 December 2024 unless stated otherwise, published October 2025.
The headline figures
Active VAT-registered enterprises | 1,187,819 |
Net growth over 2024 | +1.6% |
New registrations in 2024 | 113,289 |
Cessations in 2024 | 94,532 |
Enterprises with no employees | 997,481 (84%) |
Two things stand out. Growth slowed: +1.6% in 2024 against +2.2% in 2023. And the composition of that change shifted: new registrations were down 0.8% on the previous year, while cessations were up 6.8%. The population is still growing, but by a narrower margin on both sides.
Survival: most start-ups make the first year, fewer make five
Statbel tracks cohorts of newly created enterprises and measures how many are still active later.
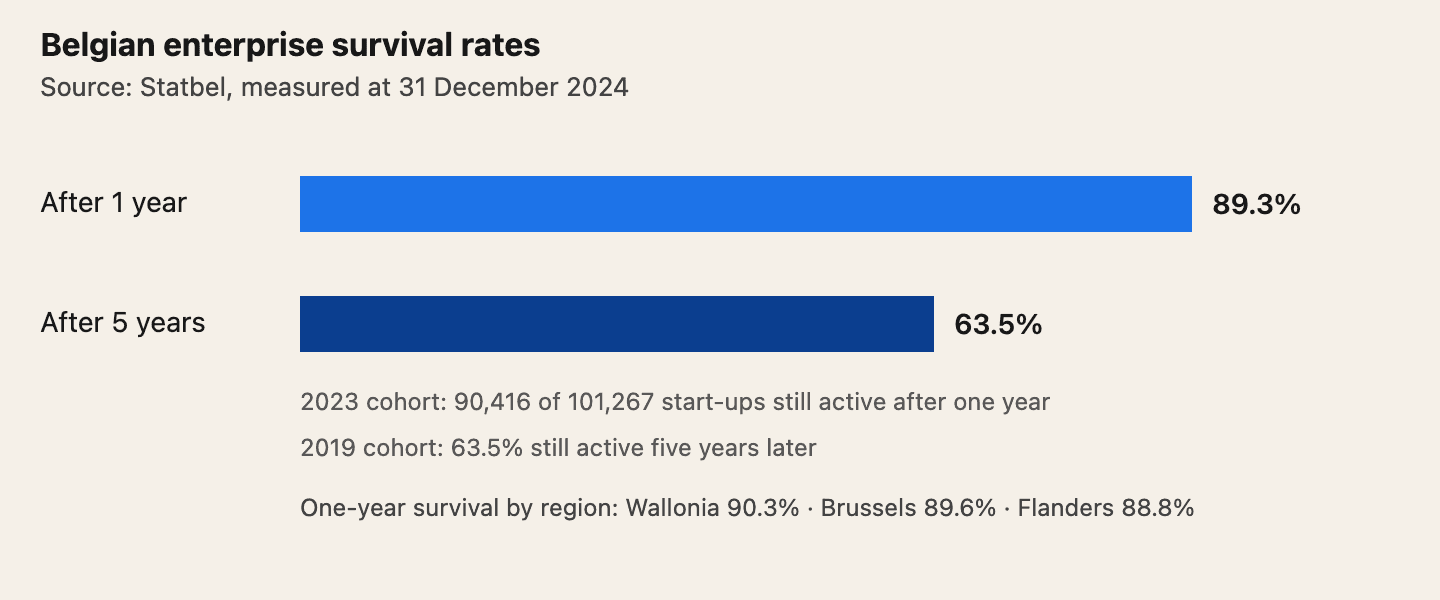
89.3% of enterprises created in 2023 were still active at the end of 2024, 90,416 out of 101,267 (Statbel). That is slightly down on the 2022 cohort, which reached 90.3%.
Over five years the attrition is much heavier: of the enterprises created in 2019, 63.5% were still active at the end of 2024.
The regional pattern is consistent and mildly counterintuitive. For the 2023 cohort, Wallonia has the highest one-year survival at 90.3%, Brussels 89.6%, Flanders lowest at 88.8%. The five-year picture keeps the same order: Wallonia 65.7%, Brussels 62.8%, Flanders 62.7%.
For anyone maintaining a Belgian database, the five-year figure is the one to plan around. More than a third of the 2019 cohort, 36.5%, was gone within five years, which sets a floor on how stale an unmaintained Belgian list becomes.
Where the companies are
Figures below from Statbel.
Region of registered office | Enterprises | Share |
Flanders | 747,395 | 62.9% |
Wallonia | 299,890 | 25.2% |
Brussels-Capital | 122,725 | 10.3% |
Registered abroad | 17,793 | 1.5% |
Unallocated | 16 | n/a |
One caution worth carrying: this is the region of the registered office, not of activity. A company can hold a Brussels seat while all its staff and sites are in Flanders; the register records the seat, not the locations. Where the work actually happens is recorded separately, as establishment units.
The largest sectors
Sector | Enterprises | Share |
Professional, scientific and technical activities | 237,240 | 20.0% |
Trade and repair of motor vehicles | 184,521 | 15.5% |
Construction | 163,465 | 13.8% |
Those three sectors alone account for 585,226 enterprises, 49.3% of the entire register.
The top sector is itself a signal about the shape of the Belgian register: professional and scientific activities is where consultancies, management companies and independent professionals sit, and it is the largest category by a wide margin. That is the same population driving the 84% with no employees.
What the numbers do not tell you
A company count is not a market. With 997,481 of those enterprises having no employees, a national headline figure is a poor starting point for any B2B plan. Our guide to TAM, SAM and SOM with real numbers works through the filtering, and the size ladder behind it.
Revenue is mostly absent. Small and micro companies file annual accounts where turnover is an optional line, so summing published revenue across the population produces a badly incomplete total. See finding a Belgian company's revenue.
Company counts and location counts are different things. One enterprise can operate many establishment units, each with its own address and activity codes. See establishment units explained.
NACE-BEL 2025: the activity-code change that breaks comparability
On 1 January 2025 Belgium moved to the NACE-BEL 2025 activity classification, implementing the European NACE Rev. 2.1 standard. Existing codes were converted automatically from the 2008 version, and the conversion was not always one-to-one: where a 2008 code mapped to several 2025 codes, only one successor was written automatically.
Anything you segment by activity code should be checked against both classifications for the time being. Bizzy carries both the 2008 and 2025 codes on each Belgian entity for exactly this reason, alongside its own industry taxonomy for cases where neither code set describes what a company actually does. Statistics published against 2008 codes and lists filtered on 2025 codes are not directly comparable.
Read next: NACEBEL codes: how to look them up, and why yours may be wrong.
Read next: Which Belgian city is easiest to find online?.
Read next: Belgian bankruptcies by province: where the increase actually is.
Frequently asked questions
How many companies are there in Belgium?
1,187,819 active VAT-registered enterprises at 31 December 2024, according to Statbel.
How many Belgian companies survive their first year?
89.3% of enterprises created in 2023 were still active at the end of 2024, 90,416 out of 101,267.
What is the five-year survival rate for Belgian businesses?
63.5% of enterprises created in 2019 were still active at the end of 2024.
How many companies are in Flanders, Wallonia and Brussels?
747,395 have their registered office in Flanders, 299,890 in Wallonia and 122,725 in Brussels-Capital, with a further 17,793 registered abroad.
What is Belgium's largest business sector by company count?
Professional, scientific and technical activities, with 237,240 enterprises, ahead of trade and vehicle repair (184,521) and construction (163,465).
Written by Arthur Cremers at bizzy., which builds European B2B company data from official registers.
Sources
Statbel: Annual evolution of VAT-registered enterprises (published 16 October 2025)
Statbel: Survivals of VAT-registered enterprises (published 16 October 2025)
Statbel be.STAT: Active enterprises by economic activity and employee size class
Statbel be.STAT: Active enterprises by legal form and location of registered office
Statbel: NACE-BEL 2025