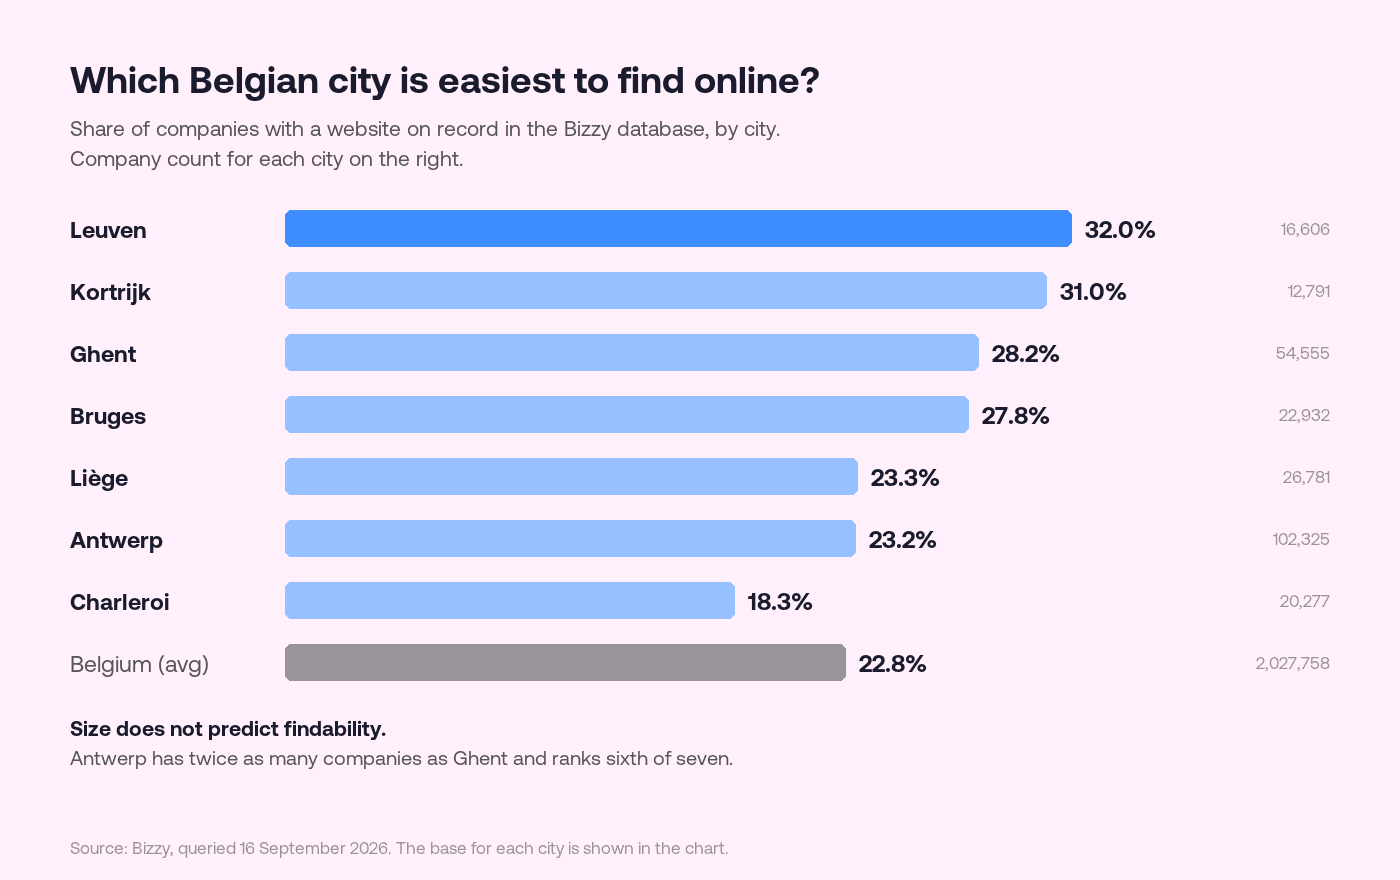
Antwerp has more companies than any other Belgian city. It has twice as many as Ghent and five times as many as Leuven. It also ranks sixth of seven on the share of those companies that have a website on record.
We checked seven Belgian cities in our own database. Size turns out to be a poor predictor of whether you can find a company online, and the gap between the best and worst city is close to fourteen percentage points.
What we measured
For each city we counted every company in our Belgian data with a registered address inside that city, then counted how many of them have a website on record. The share is that second number divided by the first, so the base for every percentage is the city itself.
City | Companies | With a website | Share |
Leuven | 16,606 | 5,318 | 32.0% |
Kortrijk | 12,791 | 3,964 | 31.0% |
Ghent | 54,555 | 15,391 | 28.2% |
Bruges | 22,932 | 6,367 | 27.8% |
Liège | 26,781 | 6,228 | 23.3% |
Antwerp | 102,325 | 23,712 | 23.2% |
Charleroi | 20,277 | 3,718 | 18.3% |
Belgium | 2,027,758 | 461,329 | 22.8% |
All figures were queried on 16 September 2026.
The size assumption is wrong
The obvious expectation is that bigger cities are more digital. Bigger companies, more competition, more agencies down the road.
That is not what the numbers say. Antwerp, with 102,325 companies, sits at 23.2%, barely above the national average. Leuven, with a sixth of that number, sits at 32.0%. Kortrijk, smaller still, comes second at 31.0%.
What separates the top from the bottom looks more like the local economy than the population. Leuven is a university city with a dense research and software cluster. Kortrijk is a design and manufacturing hub with an unusually high concentration of small, export-facing firms. Both are full of companies whose customers find them online.
Antwerp's company base is much broader. A city with a port, wholesale, logistics, diamond trade, and tens of thousands of one-person holding structures will show a lower digital share, because a large part of it does not sell to the public at all.
Where this bites in practice
If you prospect by city, this changes what a list is worth before you buy it.
A list from Charleroi will be harder to work than a list from Leuven, not because the companies are worse but because fewer of them have published anything about themselves. At 18.3%, more than four in five companies there give you nothing to research before you call.
The gap is a research cost, not a quality signal. A company without a website is not a worse prospect. It is a prospect where your rep has no way to prepare, so the first call has to do all the work. Budget more time per account in low-share cities, or accept a lower connect-to-meeting rate.
Do not read the national average as typical. At 22.8% the national figure sits between two very different populations. Planning a Flemish campaign on the national number understates what you will find. Planning a Walloon campaign on it overstates it.
What these numbers are not
Some honesty about the limits, because they matter for how far you should push this.
This measures what is on record in our data, not whether a company has a website in the world. A small firm with a Facebook page and no domain counts as having no website here, and a company whose site we have not matched counts the same way. So treat these as coverage figures, not as a census of Belgian digital adoption.
The base is our Belgian company data, which includes non-profits, co-ownership associations and entities that never register for VAT. It is a different population from the VAT-registered count published by Statbel, so these percentages should not be compared against official statistics or restated as a share of the Belgian economy.
City boundaries follow the geographic area we resolve for each city name, and a company whose registered address sits outside that shape will not appear, even if it trades there every day.
We have not measured whether the pattern holds over time. This is a single snapshot.
Related reading
For how Belgian company data is put together, see looking up Belgian company data. For the codes that describe what a company does, see NACEBEL codes. For building a target list on filters that survive contact with reality, see building a B2B ICP on real filters.
Read next: Belgian bankruptcies by province: where the increase actually is.
Frequently asked questions
Which Belgian city has the highest share of companies with a website?
Of the seven cities we measured, Leuven, at 32.0% of 16,606 companies. Kortrijk follows at 31.0%.
Which has the lowest?
Charleroi, at 18.3% of 20,277 companies, roughly four and a half points below the national average.
Does a bigger city mean more companies are online?
No. Antwerp has the most companies of any city we measured, 102,325, and ranks sixth of seven on share. The local economy predicts the figure better than the size does.
What is the Belgian average?
461,329 of 2,027,758 companies in our Belgian data have a website on record, which is 22.8%.
Does this mean four in five companies in Charleroi have no website?
It means four in five have none on record in our data. Some will have a site we have not matched, and some will use social media instead of a domain. Read it as how much you can research before a call, not as a measure of digital adoption.