Belgium recorded 11,685 bankruptcies in 2025. That is 5.6% more than in 2024, and the highest annual figure since 2013. It is not, however, a record: 2013 itself was higher, at 11,740.
That distinction matters, and it is the kind of thing that gets lost when a figure travels from a statistics office to a headline. This piece sets out what the Belgian bankruptcy data actually says, where it comes from, and which parts of it are routinely misread.
All figures come from Statbel, the Belgian statistics office. We pulled them on 11 September 2026 and aggregated them ourselves from Statbel's open data, which is published under a CC BY 4.0 licence.
The twenty-year view
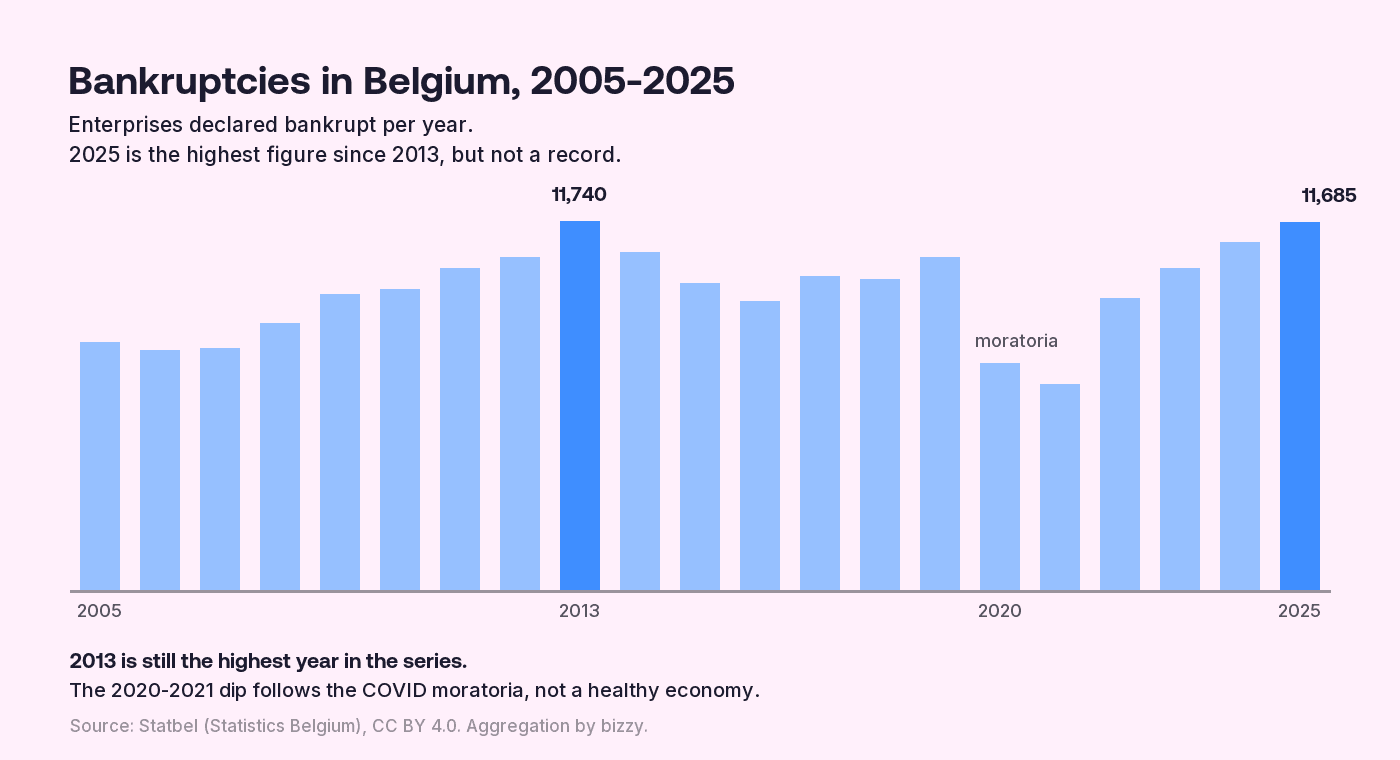
Three things stand out in the long series.
2013 is still the peak. At 11,740 bankruptcies it remains the highest year in the published data. 2025 came within 55 of it without passing it.
The 2020 and 2021 figures are artificially low. Belgium recorded 7,203 bankruptcies in 2020 and 6,533 in 2021, the two lowest years since before 2005. That was not a healthy economy. Courts and registries operated under restrictions until 18 May 2020, a temporary moratorium on bankruptcy proceedings ran until 17 June 2020, and a second moratorium approved on 6 November 2020 ran until 31 January 2021. Separately, the tax authority and the social security office stopped pursuing bankruptcy for unpaid tax and social contributions. The social security office resumed summonses from October 2021 and the tax authority from around March 2022. Statbel states plainly that government support measures have had a dampening effect on the number of bankruptcies declared since March 2020.
The recovery overshot. From the 2021 low of 6,533, the figure rose to 9,265, then 10,243, then 11,067, then 11,685. Part of that is a backlog clearing rather than new distress.
What 2026 looks like so far
Between January and July 2026 the Belgian enterprise courts declared 6,947 bankruptcies, with 16,821 associated job losses.
Month 2026 | Bankruptcies | Job losses |
January | 982 | 2,325 |
February | 965 | 2,346 |
March | 1,213 | 2,955 |
April | 1,054 | 2,379 |
May | 859 | 1,665 |
June | 1,185 | 3,127 |
July | 689 | 2,024 |
Total | 6,947 | 16,821 |
July's 689 is a 41.9% drop on June. Before reading anything into that, note what Statbel says about it: the judicial summer recess falls in July and August, and while the courts stay open, the number of hearings is reduced, so bankruptcy figures in this period are lower. A July or August figure is not a trend.
The Flemish figure is the one worth watching. At 4,166 bankruptcies for the first seven months, Flanders is already 3.8% above the same period in 2025, which was itself a record.
Who actually goes bankrupt
Almost all of them are very small companies. In July 2026, 624 of the 689 bankruptcies were businesses with between zero and four employees. That is roughly nine in ten.
By legal form, the 2025 breakdown was:
Legal form | 2025 bankruptcies |
BV (private limited company) | 7,767 |
Sole trader | 2,283 |
VOF and similar partnerships | 881 |
NV and limited partnerships | 510 |
This shapes how you should read the job-loss figure. One bankruptcy means one enterprise, not one person. A partnership with several partners counts once. And 29,877 jobs lost across 11,685 bankruptcies averages under three per failure, which tells you the same story as the size distribution.
The age curve is the surprise
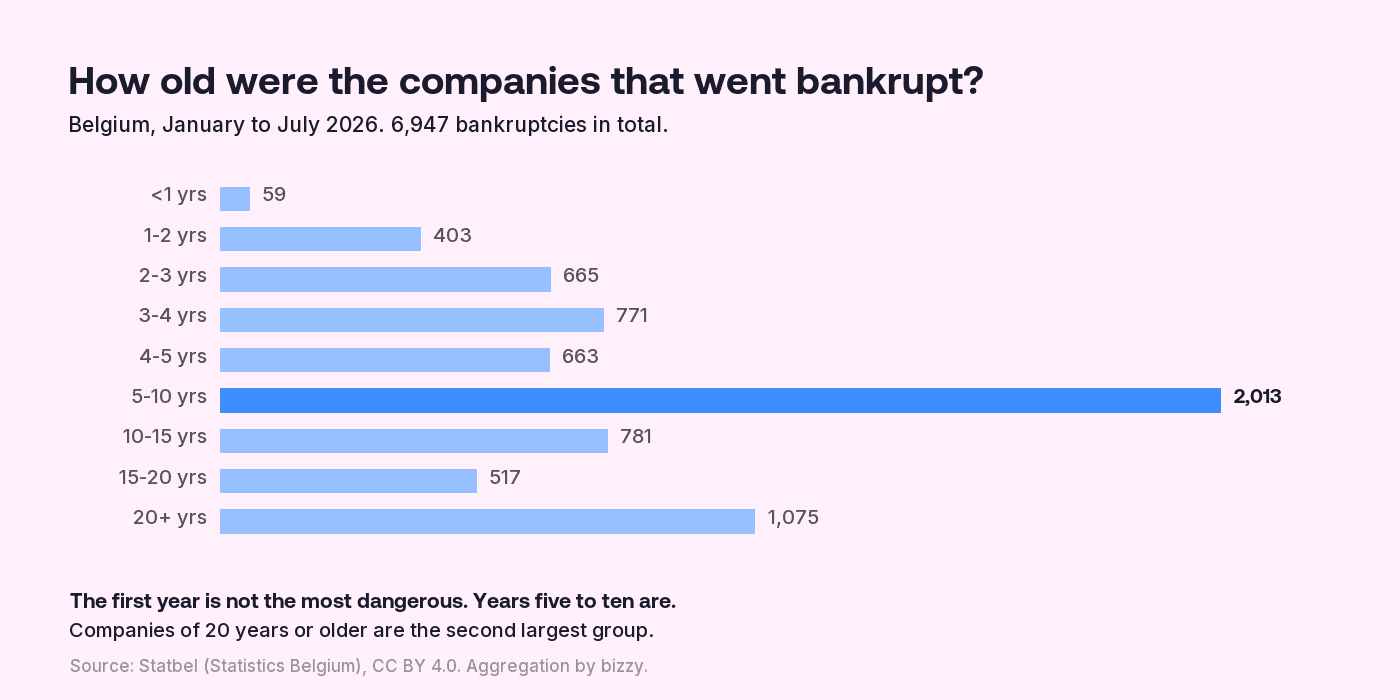
The received wisdom is that the first year kills companies. The Belgian data says otherwise.
Businesses under a year old accounted for 59 bankruptcies in the first seven months of 2026, the smallest band in the set. The largest is companies aged five to ten years, at 2,013. The second largest is companies of twenty years or more, at 1,075.
There is a mechanical reason for part of this. A company that stops trading in its first year often has no creditors willing to fund a bankruptcy petition, and quietly dissolves instead. But the shape still holds a useful lesson for anyone assessing a prospect or a supplier: age is not safety, and a company that has survived a decade is not thereby out of danger.
Where and in what
By province, for January to July 2026:
Province | Bankruptcies |
Brussels-Capital | 1,221 |
Antwerp | 1,195 |
East Flanders | 943 |
Flemish Brabant | 930 |
West Flanders | 662 |
Hainaut | 481 |
Liege | 466 |
Limburg | 436 |
Namur | 287 |
Walloon Brabant | 267 |
Luxembourg | 59 |
By sector, the eight largest for the same period:
Sector | Bankruptcies |
Construction | 1,594 |
Wholesale, retail and vehicle repair | 1,323 |
Accommodation and food service | 1,193 |
Professional, scientific and technical | 540 |
Transport and storage | 524 |
Administrative and support services | 438 |
Manufacturing | 294 |
Information and communication | 257 |
Construction, retail and hospitality together account for more than half of all Belgian bankruptcies. That concentration has been stable for years and is the single most useful thing in this dataset for anyone building a territory plan.
Four things the numbers do not tell you
They lag the economy. Statbel repeats this caveat on every page: there is a delay between a business ceasing activity and the court declaring it bankrupt, so an economic shock only shows up in the figures some time later. Treat the series as a rear-view mirror.
They are revised upward. The January 2026 press release put 2025 at 11,665 bankruptcies and 29,842 job losses. The current database says 11,685 and 29,877. The revisions are small and, across the seven months of 2026 we compared, always upward. Statbel publishes no revision policy, so this is our observation rather than its statement. If you cite a figure, cite the date you pulled it.
The weekly series is stale. Statbel used to publish a weekly bankruptcy count. That page still shows week 50 of 2025, dated 17 December 2025, and the underlying file has not changed since. There is no notice explaining why. Use the monthly series.
A bankruptcy is a specific legal event. Statbel counts an enterprise as bankrupt when it has ceased paying its creditors and its credit has dried up, under Book XX of the Code of Economic Law. Companies that wind down voluntarily, get struck off the register, or enter judicial reorganisation are not in this count. Plenty of businesses disappear without ever appearing here.
How to check a specific company
This dataset is statistics, not a lookup. It will not tell you whether one particular company is bankrupt. For that you need a different route, which we cover in how to check whether a Belgian company is bankrupt.
If you want the earlier signals instead, the ones that show up before a court ever gets involved, the filed accounts are where to look. Solvency, liquidity and profitability explains which ratios move first, and how to read a Belgian company's annual accounts covers where to find them.
Method and reuse
Figures were retrieved from Statbel on 11 September 2026. Annual and monthly totals come from Statbel's published tables. The province, sector, business-age and legal-form breakdowns were aggregated by us from Statbel's open microdata extract, and cross-checked against the published tables where an equivalent exists.
Statbel publishes under a CC BY 4.0 licence, which permits commercial reuse and derivative works with attribution. The correct attribution is: Bron: Statbel (Algemene Directie Statistiek, Statistics Belgium), CC BY 4.0. The charts on this page are our aggregations of that data, and Statbel does not endorse them or us.
Statbel publishes monthly, roughly fifteen days after the reference month. August 2026 figures are scheduled for 18 September 2026.
Frequently asked questions
How many bankruptcies were there in Belgium in 2025?
11,685, according to Statbel data retrieved in September 2026. Statbel's January 2026 press release gave 11,665; the figure has since been revised slightly upward. That is a 5.6% increase on 2024, when there were 11,067.
Was 2025 a record year for Belgian bankruptcies?
No. It was the highest annual figure since 2013, but 2013 itself was higher at 11,740. Job losses tell a similar story: 29,877 in 2025 against 31,738 in 2013.
Why were 2020 and 2021 so low?
Because of COVID-era measures rather than economic health. Court activity was restricted, two separate moratoria on bankruptcy proceedings ran between May 2020 and January 2021, and the tax and social security authorities suspended their own bankruptcy summonses until late 2021 and early 2022 respectively.
How current is the data?
Statbel publishes monthly figures about fifteen days after the month ends. As of 11 September 2026 the latest published month is July 2026. The weekly series has not been updated since 17 December 2025.
Can I use these figures and charts?
Yes, with attribution. Statbel's data is CC BY 4.0, which allows commercial use and derivative works provided you credit Statbel, link to the licence, and say that you changed the data. If you use our charts, please credit Statbel as the source and bizzy for the aggregation.