Belgian bankruptcies by province: where the increase actually is
Conseils
Belgium recorded 11,685 company bankruptcies in 2025. That is the second highest figure in twenty-one years of published data, 55 cases short of the 2013 record of 11,740.
The national total is the number that gets quoted. It is also the number that hides the most, because the increase since 2019 is not spread across the country. One administrative district absorbs most of it.
Two neighbouring districts, opposite directions
Flemish Brabant has two districts. Halle-Vilvoorde wraps around Brussels to the west and north. Leuven sits directly to its east. Same province, same courts, same insolvency law, same decade.
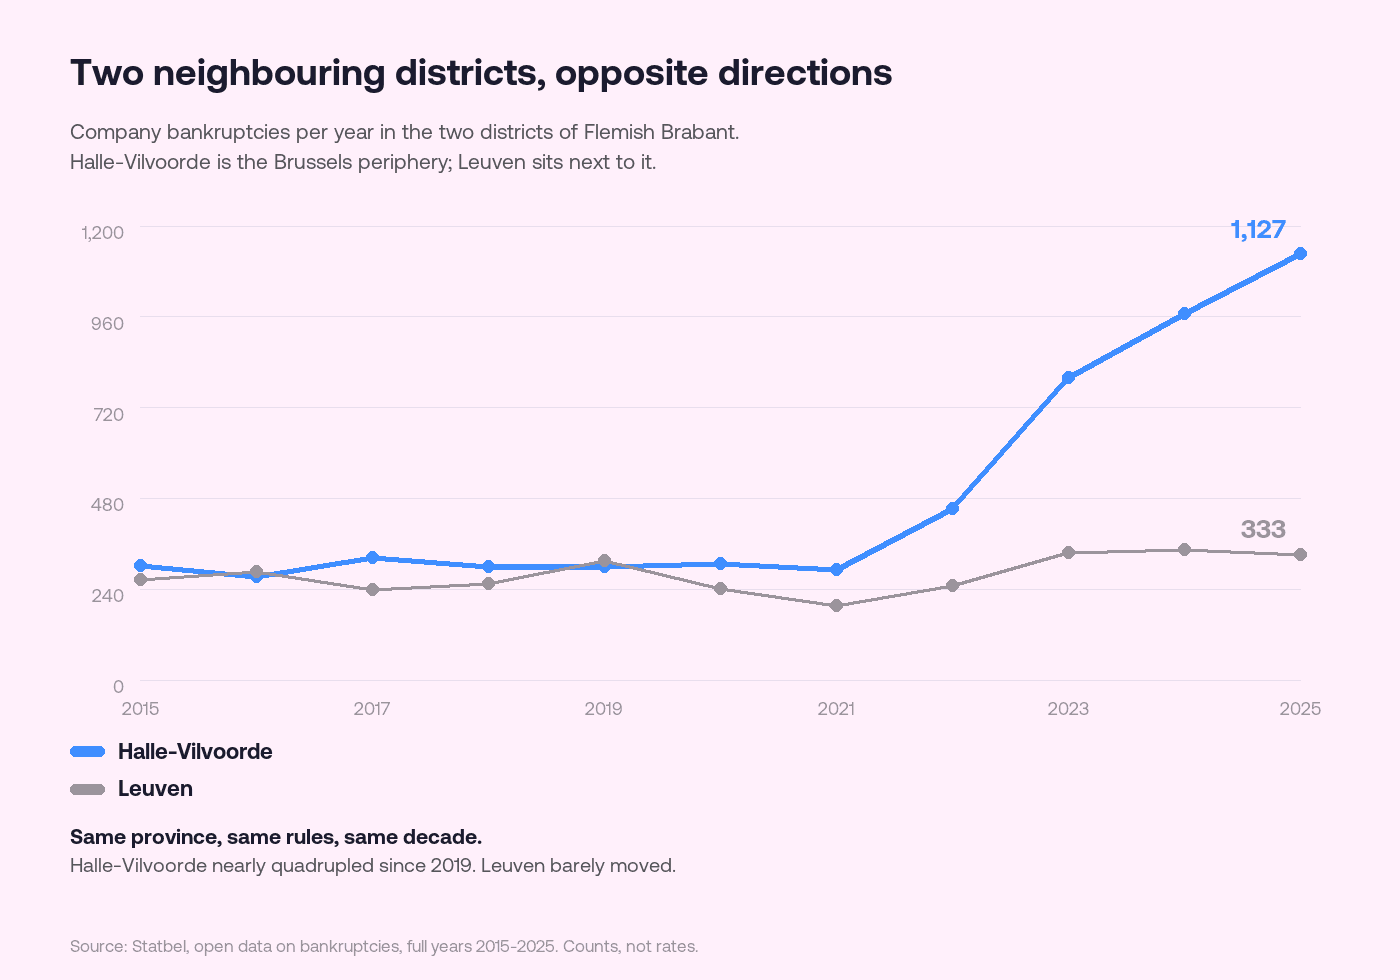
Until 2021 the two districts tracked each other between roughly 200 and 330 cases a year. Then they separated. Halle-Vilvoorde went from 299 bankruptcies in 2019 to 1,127 in 2025, close to four times as many. Leuven went from 317 to 333.
At province level this shows up as Flemish Brabant rising 157% since 2015, far ahead of every other province. That provincial figure is real, but it is misleading as a description of the province. Nothing much happened in Leuven. Everything happened in the ring around Brussels.
The pattern is municipal, and it is tight
Inside Halle-Vilvoorde the increase concentrates in a small number of municipalities in the immediate Brussels periphery.
Municipality | 2019 | 2025 |
Zaventem | 33 | 227 |
Sint-Pieters-Leeuw | 19 | 116 |
Wemmel | 12 | 90 |
Dilbeek | 34 | 83 |
Grimbergen | 12 | 67 |
Kraainem | 2 | 65 |
Asse | 21 | 64 |
Overijse | 11 | 52 |
Machelen | 18 | 50 |
Sint-Genesius-Rode | 8 | 47 |
Zaventem alone went from 33 cases to 227. Kraainem went from 2 to 65. These are municipalities on the Brussels border, several of them along the airport corridor.
Transport and storage is the clearest thread
Nationally, transport and storage is the fastest deteriorating sector in the data. It went from 424 bankruptcies in 2015 to 833 in 2025, up 96%. Construction is second, up 57% over the same period to 2,790 cases, and remains the largest sector by volume at 23.9% of all 2025 bankruptcies.
Halle-Vilvoorde's role in the transport figure is the sharpest statistic in this dataset.

In 2019 the district accounted for 4.0% of every Belgian bankruptcy in transport and storage. In 2025 it accounted for 18.0%. Roughly one in five transport failures in the country now sits in a single district.
This particular measure is worth trusting more than the raw counts. It is a share of a national total, so both the numerator and the denominator are bankruptcies. It does not depend on how many companies are registered in the district, which is exactly the weakness of the count-based figures above.
It is not simply post-COVID catch-up
The obvious objection is that this is a rebound. Belgium suppressed bankruptcy filings during the pandemic through moratoriums and support measures, and the data shows it: 7,203 cases in 2020 and 6,533 in 2021, both far below the 10,598 recorded in 2019. When the support ended, the backlog arrived.
That explains the national shape. It does not explain the divergence. A catch-up effect should lift every district roughly in proportion, because every district had cases held back. Leuven rebounded to 333 cases in 2025, marginally above its 2019 level of 317. Halle-Vilvoorde rebounded to 1,127, close to four times its 2019 level. Two neighbouring districts under the same national measures did not come out of the same suppression the same way.
Whatever is happening in the Brussels periphery started before the pandemic in the transport figures, where the district's share of national transport bankruptcies had already risen from 2.6% in 2015 to 8.6% in 2020, then accelerated sharply.
What these numbers do not tell you
Four limits matter, and they matter more than usual here.
These are counts, not failure rates. Statbel publishes bankruptcies by municipality. It does not publish the number of active companies per municipality in the same release, so we cannot divide one by the other. If the number of companies registered in Zaventem grew substantially over the same period, part of the rise reflects a larger population rather than a higher risk per company. The national company stock did not grow anywhere near fourfold, so population growth cannot account for most of the change, but it is very likely to account for some of it.
A registered office is not an operation. Belgian bankruptcy statistics are attributed to the company's registered address. For the Brussels periphery in particular, a registered address is often an administrative one. Holding structures, transport and logistics companies near the airport, and businesses that serve Brussels while registering just outside it all land in these municipalities. A company counted in Zaventem may have had no staff or premises there. If you want to know where a company actually operates, you need its establishment units rather than its registered seat.
Sector labels follow the register, not the activity. A company's NACE code is what it declared, and declarations drift. Our guide to NACEBEL codes covers how far that drift can go.
A bankruptcy is an endpoint, not a warning. By the time a case appears in this dataset the decision is made. For the signals that come earlier, see how to spot a customer heading for trouble.
For the national picture across two decades, sectors and company age, see our Belgian bankruptcy figures. For checking one specific company rather than a trend, see how to check whether a Belgian company is bankrupt.
What to do with this if you sell into Belgium
Three practical consequences.
Treat a Brussels periphery address as a question, not an answer. If your territory or your reporting splits Belgium by registered address, the ring around Brussels will look different from how it trades. Check establishment units before you draw a conclusion about where an account really sits.
Watch transport and logistics portfolios more closely than the national average suggests. The sector is deteriorating faster than any other, and the deterioration is geographically concentrated. If your customer base leans that way, your exposure is not the national trend.
Separate the alarming number from the useful one. The 157% provincial rise is the number that will circulate. The 4.0% to 18.0% concentration is the one that tells you something you can act on, because it does not depend on company counts.
If you are building or cleaning a list of Belgian companies, our guide to Belgian company data sources covers which register gives you what, and the company register guide covers how the KBO is structured.
Frequently asked questions
Which Belgian province has the most bankruptcies?
By raw count in 2025, Antwerp province recorded the most at 2,088, followed by Flemish Brabant at 1,460 and East Flanders at 1,404. The Brussels-Capital Region, which is not a province, recorded 2,190. Raw counts largely track the size of the local economy, so they are a poor measure of risk on their own.
Was 2025 a record year for Belgian bankruptcies?
No. 2025 recorded 11,685 bankruptcies, the second highest in the published series that begins in 2005. The peak remains 2013 at 11,740.
Why is Halle-Vilvoorde rising so much faster than Leuven?
The data shows the divergence clearly but does not explain it. The most likely contributors are the concentration of transport and logistics activity along the Brussels airport corridor, and the use of periphery municipalities as registered addresses for companies whose operations sit elsewhere. Both would place cases in these municipalities without reflecting a uniquely local business climate.
Are these figures bankruptcies or company closures?
Bankruptcies only. A bankruptcy is a court judgment. Most companies that stop trading do so through voluntary liquidation or simply by ceasing activity, and those do not appear in this dataset.
Where does this data come from?
Statbel, the Belgian statistical office, publishes bankruptcies as open data with year, month, municipality, district, province, region, NACE code, legal form, employment class and company age. This analysis uses full calendar years from 2015 to 2025. The 2026 data currently covers January to July only and is excluded.