Account-based marketing content is generous about method and silent about arithmetic. It will tell you how to tier accounts, build plays and align sales with marketing. It will not tell you how many accounts should be in the programme, which is the first thing anyone actually running one needs to decide.
In Belgium that number is knowable, because the population is published. This page works it out, and the answer reshapes what a Belgian ABM programme can sensibly look like. For the method itself, start with account-based marketing explained. This is the sizing layer underneath it.
Published 12 September 2026. Statbel figures reflect a 31 December 2024 reference date, which is updated annually. The Trends Top 5,000 rankings are for the 2023 financial year, as reported in November 2024, the most recent edition we have verified.

Key takeaways
Belgium has 15 enterprises with 10,000+ employees, 57 with 5,000+, 390 with 1,000+ and 1,720 with 250+.
A true one-to-one tier in Belgium is measured in dozens of accounts, not hundreds.
Many of the largest Belgian entities are subsidiaries of foreign groups: the real account often sits abroad.
Belgian ABM is mostly a one-to-few motion in the mid-market, not an enterprise motion.
Tier by what is filed: headcount, ownership, establishment count. All three are public.
Start with the population, not the framework
The standard tier model (one-to-one, one-to-few, one-to-many) is sound. The mistake is designing the tiers first and then looking for accounts to fill them, because in a market Belgium's size the top tier runs out.
Here is the whole large-company population of the country, from Statbel at 31 December 2024.
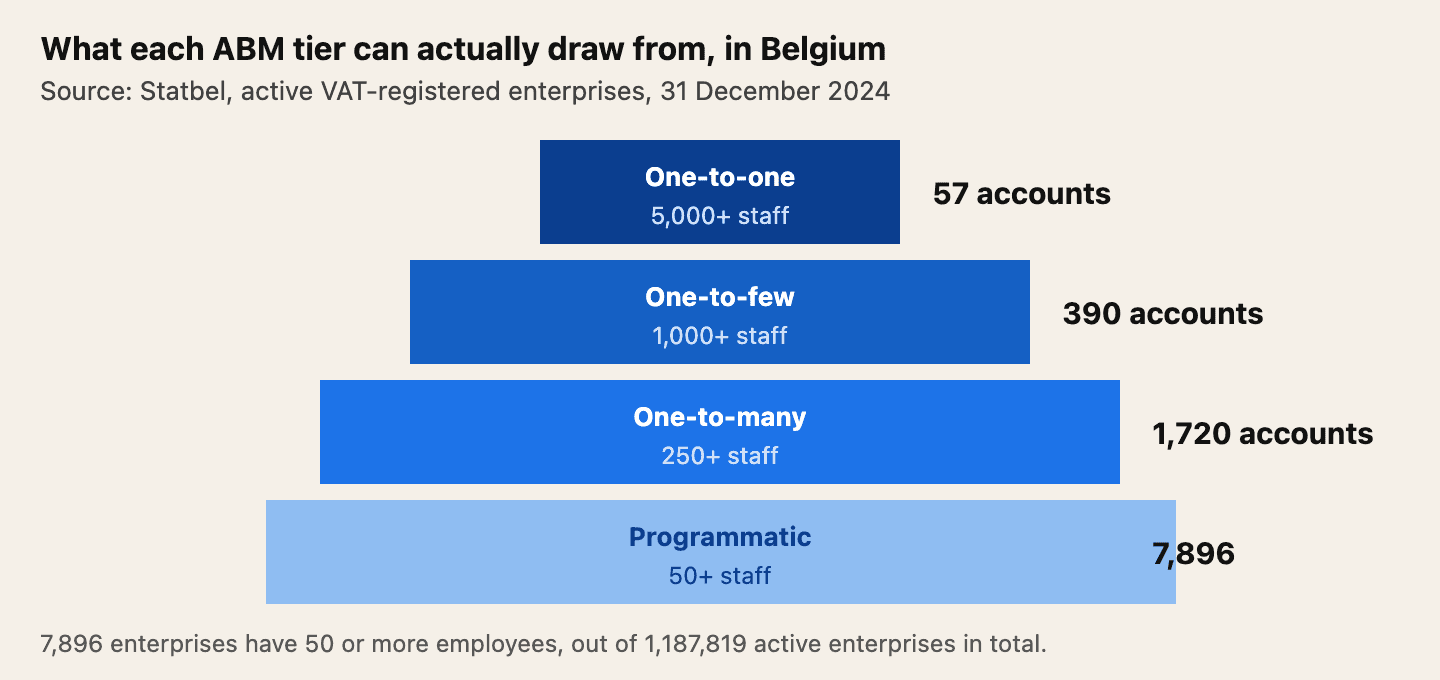
Fifteen Belgian enterprises employ ten thousand people or more. Fifty-seven employ five thousand or more. If your one-to-one tier is supposed to hold the genuine giants, it holds dozens of names and every competitor you have is working the same dozens.
The number that matters more for most teams is 390, enterprises with a thousand or more staff, and 1,720 at two hundred and fifty or more. Below that the population opens up sharply: 7,896 companies have fifty or more employees.
What each of those tiers actually is, and where each one breaks, is set out in the three types of ABM.
What this does to tier design
Three consequences follow directly.
Your top tier is smaller than the template assumes. Most ABM frameworks are written from US or pan-European examples where the enterprise segment runs to thousands of accounts. In a single Belgian market it does not. If a one-to-one tier needs fifty accounts to justify its cost, you are describing essentially every large company in the country, including the ones that will never buy what you sell.
One-to-few is the realistic centre of gravity. The Belgian mid-market, a few thousand companies between fifty and a few hundred staff, is large enough to segment meaningfully and small enough to treat with real account knowledge. That is where a Belgian ABM programme usually earns its keep.
Sector cuts bite hard. Take 1,720 companies with 250+ staff, restrict to one sector and one region, and you can be down to a few dozen accounts before you have qualified anything. Model the sequence before you commit to it. TAM, SAM and SOM with real numbers walks through exactly this kind of subtraction.
The subsidiary problem
There is a second filter the size table cannot show you, and in Belgium it is severe.
Several of the largest companies by filed turnover are Belgian entities of foreign groups. In the 2023 financial year the top of that ranking was Toyota Motor Europe, Pfizer in Puurs, ExxonMobil, Janssen Pharmaceutica and TotalEnergies (Trends Top 5,000, reported November 2024), enormous in Belgium, and mostly not where the decision is made. We work through why those rankings diverge in the largest companies in Belgium.
For ABM this is decisive rather than inconvenient. An account plan aimed at a subsidiary that cannot authorise the purchase is a plan aimed at an influencer. Sometimes that is the right play and you build the programme around internal advocacy towards a parent. But you have to know which situation you are in, and ownership is published, so there is no excuse for finding out in month four.
Two things to establish for every account that clears the size filter:
Is the Belgian entity independent, part of a Belgian group, or a subsidiary of a foreign parent? The ownership tree answers this.
If it is a subsidiary, what is bought locally? Sites, headcount and establishment units usually tell you more about local autonomy than the org chart does.
Tier on fields you can actually check
The advantage of building a Belgian account list is that most of the tiering criteria are filed rather than estimated.
Tier criterion | The published field | Why it works |
Size | Annual average headcount, with multi-year trend | Filed by every company that files accounts; turnover is not |
Trajectory | Change in headcount and new hires | Separates growth from scale |
Footprint | Number of establishment units | A proxy for sites, and for per-site products |
Autonomy | Ownership and group structure | Decides whether the account can buy |
Financial headroom | Equity, debt ratio, credit score | Separates large from solvent |
Timing | Appointments, restructurings, vacancies | Dated events, not states |
Note what is missing: revenue. Turnover is an optional line on the micro and abbreviated filing models, so tiering a Belgian account list by published revenue drops most of the mid-market silently. See finding a Belgian company's revenue.
Building the list
The practical order for a Belgian programme, once the tiers are sized:
Set the floor by headcount, using the population table above so you know what each threshold costs you in reachable accounts.
Cut by sector, using activity codes as a coarse filter and something current (website content, job ads) to correct for codes that were registered years ago.
Resolve ownership on everything that survives, and mark the subsidiaries.
Layer timing signals (recent appointments, headcount jumps, hiring bursts) and let them decide sequence rather than membership.
Build headroom into the floor. Accounts leave a segment without failing. They get acquired, restructured, or absorbed into a parent, and each one that goes is an account plan you have already paid for.
Bizzy is built for steps one to four running as one query rather than four projects: headcount bands and their trend, the ownership tree with percentages and countries, establishment counts, credit score, open vacancies and appointment signals are filters over the same Belgian population. Lookalike search is the useful shortcut when your best account is easier to point at than to specify.
Frequently asked questions
How many accounts should an ABM programme have?
It depends on what your market can supply. In Belgium, 57 enterprises have 5,000 or more employees and 390 have 1,000 or more, so a one-to-one tier is realistically dozens of accounts and a one-to-few tier a few hundred.
Is ABM worth doing in a market the size of Belgium?
Usually as a one-to-few motion in the mid-market rather than an enterprise motion. Belgium has 1,720 enterprises with 250 or more staff and 7,896 with 50 or more, which is enough to segment and small enough to know well.
How do I tier Belgian accounts?
On filed headcount and its trend, establishment count, ownership structure, financial headroom and dated events such as appointments. All of those are public; published revenue is not available for most companies.
Why does ownership matter for account selection?
Because many of the largest Belgian entities are subsidiaries of foreign groups and cannot authorise a purchase locally. Ownership is published, so it should be resolved before an account plan is written, not after.
What happens to an ABM tier when you add a sector filter?
It shrinks fast. Starting from the 1,720 Belgian enterprises with 250 or more staff, one sector and one region can leave a few dozen accounts before any qualification has happened, so model the sequence before committing to the tier.
Written by Arthur Cremers at bizzy., which builds European B2B company data from official registers.
Sources
Statbel be.STAT: Active enterprises by economic activity and employee size class (reference date 31 December 2024)
Statbel: Annual evolution of VAT-registered enterprises (published 16 October 2025)
Statbel: Survivals of VAT-registered enterprises (published 16 October 2025)
Trends Top 5,000, financial year 2023: as reported 12 November 2024
National Bank of Belgium: Central Balance Sheet Office
Photo of business people in discussion by Rawpixel Ltd, CC BY 2.0, via Wikimedia Commons