The short answer
In the second quarter of 2026, Belgian employers had 133,881 open vacancies, 18.1% fewer than a year earlier. The job vacancy rate, open vacancies as a share of all jobs, fell to 3.26%, its lowest second-quarter level since 2020. Accommodation and food service is the only sector where vacancies rose sharply: up 29% on a year earlier, with the highest vacancy rate of any sector at 6.45%. Construction (5.53%), professional, scientific and technical services (5.26%) and ICT (4.77%) follow, but all three are hiring less than in 2025. The biggest drop is in administrative and support services, which include temporary work agencies: its vacancies halved.
All figures come from Statbel's quarterly Job Vacancy Survey for Q2 2026, published on 11 September 2026. We update this page with each new quarter.
Hiring demand is at its lowest point since 2020
Vacancies peaked in the second quarter of 2022, after the post-COVID reopening. They have fallen every year since, and the second quarter of 2026 sits below the pre-pandemic years of 2018 and 2019.
Second quarter | Open vacancies | Vacancy rate |
|---|---|---|
2018 | 143,500 | 3.53% |
2019 | 139,000 | 3.41% |
2020 | 120,900 | 3.03% |
2021 | 172,400 | 4.18% |
2022 | 213,800 | 4.97% |
2023 | 195,000 | 4.63% |
2024 | 184,000 | 4.35% |
2025 | 163,600 | 3.91% |
2026 | 133,900 | 3.26% |
That is 37% fewer vacancies than at the 2022 peak. Belgium still has one of the tightest labour markets in the EU: Eurostat puts the Belgian rate at 3.3% for the quarter, second only to the Netherlands at 4.1%, against 2.0% for the EU as a whole (Eurostat).
Which sectors are hiring most
There are two ways to read "hiring most". The vacancy count tells you where the most jobs are open. The vacancy rate tells you where employers struggle most to fill them, because it controls for the size of the sector. For anyone selling to employers, the rate is usually the more useful signal: it shows where hiring is a pressing problem rather than routine.
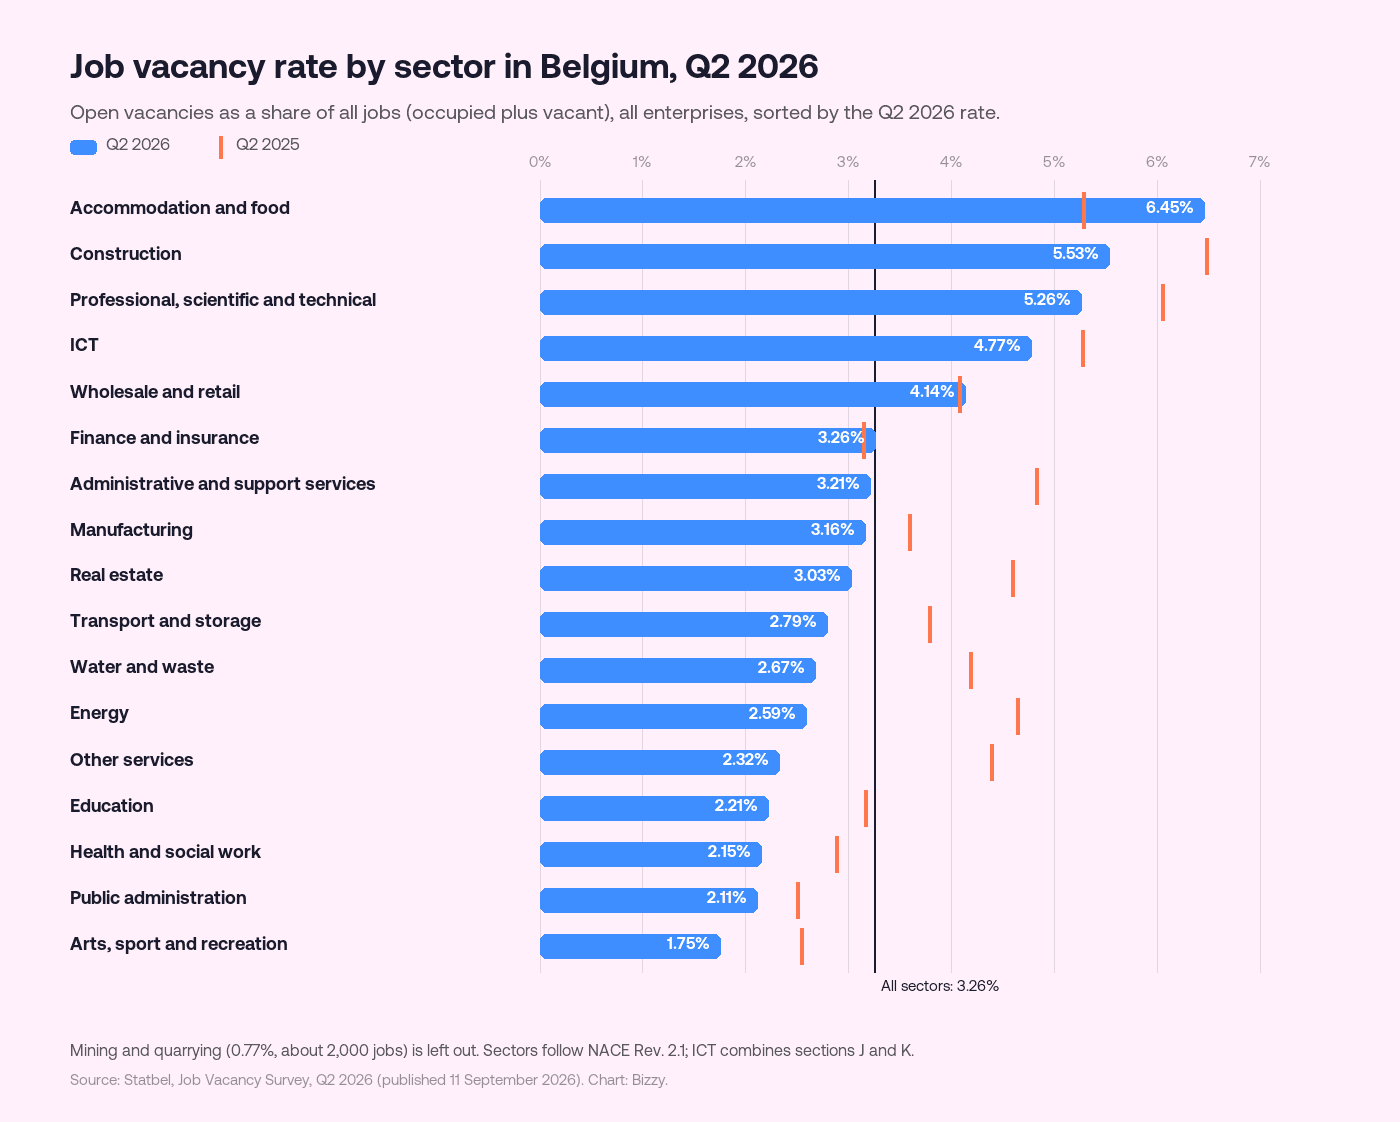
Vacancy rate and open vacancies in the second quarter of 2026, each with the change against the second quarter of 2025.
Sector | Rate | Change | Vacancies | Change |
|---|---|---|---|---|
Accommodation and food | 6.45% | +1.17 pts | 8,903 | +29.0% |
Construction | 5.53% | -0.95 pts | 12,432 | -17.0% |
Professional, scientific and technical | 5.26% | -0.79 pts | 12,168 | -14.1% |
ICT | 4.77% | -0.50 pts | 6,603 | -8.5% |
Wholesale and retail | 4.14% | +0.06 pts | 20,935 | -2.5% |
Finance and insurance | 3.26% | +0.11 pts | 3,469 | +3.9% |
Administrative and support services | 3.21% | -1.63 pts | 8,222 | -48.7% |
Manufacturing | 3.16% | -0.43 pts | 15,253 | -14.6% |
Transport and storage | 2.79% | -1.00 pts | 7,267 | -29.2% |
Education | 2.21% | -0.95 pts | 8,212 | -29.4% |
Health and social work | 2.15% | -0.73 pts | 14,381 | -26.5% |
Public administration | 2.11% | -0.40 pts | 9,003 | -17.3% |
All sectors | 3.26% | -0.66 pts | 133,881 | -18.1% |
Smaller sectors (energy, water and waste, real estate, arts and recreation, other services, mining) are in the chart but left out of the table; together they account for about 7,000 vacancies.
Accommodation and food is the exception. It is the one sector where hiring clearly picked up; finance and insurance edged up too, by 3.9%, but from a much smaller base. Compared with the first quarter, Statbel records a jump of 2.23 points in its rate, the largest increase of any sector (Statbel). Part of that is the season, but the comparison with the second quarter of 2025, which has the same season, still shows 29% more open vacancies.
Construction is still hard to staff, just less so. It has had one of the highest vacancy rates for years and is second today, but it lost almost a point on a year earlier.
Knowledge work has cooled the most since 2022. The ICT vacancy rate was 9.13% in the second quarter of 2022 and is 4.77% now. Professional, scientific and technical services went from 9.39% to 5.26%. Both are still above the national rate, so the demand has not gone, it has halved.
Administrative and support services halved their vacancies in a year. This section includes temporary work and staffing agencies, cleaning, security and call centres. Its open vacancies went from 16,024 to 8,222.
The public and care sectors have many vacancies but low rates. Health and social work alone has 14,381 open vacancies, more than construction, but it is so large (about 650,000 jobs) that the rate is only 2.15%. Wholesale and retail has the most vacancies of any single sector, 20,935.
Where in Belgium
The Flemish Region holds 65.6% of all vacancies and has the highest rate. The table shows open vacancies in the second quarter of 2026, the change against a year earlier, and the vacancy rate.
Region | Vacancies | Change | Rate | Highest-rate larger sector |
|---|---|---|---|---|
Flemish Region | 87,764 | -17.7% | 3.65% | Accommodation and food, 8.25% |
Walloon Region | 29,805 | -17.5% | 2.73% | ICT, 5.73% |
Brussels-Capital Region | 16,312 | -21.5% | 2.66% | Professional, scientific and technical, 4.42% |
Larger sectors means those with at least 20,000 jobs in the region; very small sectors can show high rates on a handful of vacancies. The decline is almost identical in Flanders and Wallonia and slightly steeper in Brussels. The sector mix differs: in Flanders the pressure is in hospitality and construction, in Wallonia it is ICT, and in Brussels it is professional services and ICT.
Small companies and temporary jobs
Two details from the same survey are worth knowing if your buyers are SMEs:
Small companies struggle more. Enterprises with fewer than ten employees have a vacancy rate of 5.33%, against 2.96% in larger ones. Larger employers post more vacancies in total, 3.88 times as many, but one open role weighs much more on a small team.
Temporary roles are the hardest to fill. 87.1% of vacancies are for permanent positions, but the vacancy rate for temporary positions is 15.27%, against 2.92% for permanent ones.
What this means if you sell to Belgian companies
A sector's vacancy rate tells you where hiring is a live problem, which matters if you sell recruitment, staffing, HR software, training or anything that saves labour. Hospitality, construction, professional services and ICT are where that problem is most acute right now, and small companies feel it more than large ones.
A sector average does not tell you which company to call. For that you need the company-level signal: which businesses have open roles today. Bizzy tracks job openings per company, from company websites and, in Belgium, VDAB vacancies, so you can build a list of companies that are hiring in a given sector and region (Bizzy data). The practical method, with the free public sources as well, is in our guide on how to find Belgian companies that are hiring. For the wider picture of the Belgian company base, see the Belgian business landscape in numbers, and for the other end of the cycle, Belgian bankruptcies in numbers.
How to read these numbers
Source. Statbel's Job Vacancy Survey, a quarterly survey of Belgian enterprises in the sectors Statbel labels B to T of NACE Rev. 2.1. Agriculture is not covered. The figures on this page come from the full data file Statbel publishes with each release.
Vacancy rate. Open vacancies divided by all jobs, occupied plus vacant. It is the measure Eurostat uses to compare countries.
Sector names. We use short names for the NACE sections. "ICT" is Statbel's combination of sections J and K; "administrative and support services" is section O and includes temporary work agencies.
Survey, not a census. The figures are estimates from a sample and are revised when new data comes in. The table above uses the values in Statbel's data file of 11 September 2026, so older quarters can differ slightly from earlier press releases.
Why not our own data. Bizzy's job-opening data is collected per company, which is what makes it useful for prospecting, but it is not a representative sample of the Belgian labour market. For the national and sector picture we use the official survey.
Frequently asked questions
Which sector in Belgium has the most job vacancies? By count, wholesale and retail, with 20,935 open vacancies in the second quarter of 2026, followed by manufacturing (15,253) and health and social work (14,381). By vacancy rate, accommodation and food service, at 6.45%.
Is the Belgian labour market cooling? Yes. Vacancies fell 18.1% on a year earlier to 133,881, and the vacancy rate of 3.26% is the lowest for a second quarter since 2020. It is still the second-highest rate in the EU, after the Netherlands.
Which region has the most vacancies? The Flemish Region, with 87,764 open vacancies, 65.6% of the Belgian total, and a vacancy rate of 3.65%.
How often are these figures updated? Statbel publishes the survey every quarter. We refresh this page when the next quarter is released.